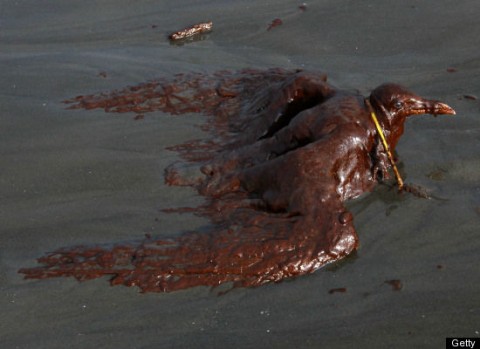
Image via Boston Here’s a handy infographic to bring you up to speed on the cleanup operations following the April 20th explosion on the Deepwater Horizon oil rig . Also included are easily digestible stats on how much, approximately, operations have cost thus far. It’s brief and to the point, and makes for a solid quick reference point. Infographic is after the jump: … Read the full story on TreeHugger

Read this article:
Who’s Cleaning Up the BP Spill & How Much Has it Cost? (Infographic)


